
Language switcher


What is ArcGIS?
ArcGIS: The World Leader in GIS Software
 Esri’s ArcGIS is a GIS (geographical information systems) software which allows users to manage and analyse geographical information by visualising a range of geographical statistics through layer building maps (such as trade flows or climate data). It is used by a whole host of academic institutions and departments, both in the sciences and humanities, to develop and illustrate groundbreaking research. Further it is used by many governments and commercial/private institutions worldwide.
The system has the capability to make geographical information accessible throughout an institution, company, privately or openly on the internet. As such, the software essentially works as a platform through which geographical data can be connected, shared and analysed.
Origins and Early Development
Esri, formerly known as Environmental Systems Research Institute, was founded in 1968 as a consulting firm under Jack and Laura Dangermond. They began producing their updated GIS-based software around 1997, premiering ArcMap in 1999. ArcMap was eventually replaced by ArcGIS in 2000. Although commonly referred to as the group of desktop applications and tools used for GIS mapping, it now consists of a whole platform or infrastructure of software and services which is fully mobile and can be cloud based.
Among its more recently groundbreaking aspects of platform integration, users can incorporate 3D modelling, spatial analysis, complex map visualisations, data navigation and real time geographical informational gathering, all through data management and collection tools. As such, where previous incarnations of the program were limited to geographical information mapping, it has developed into an industry leading platform with cutting-edge cloud capabilities.
How Does it Work?
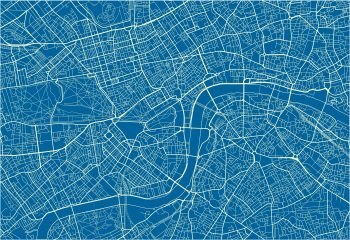
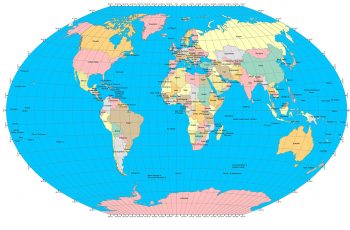
Like most GIS software programs, ArcGIS builds maps which require categories organised as layers. Each layer is registered spatially so that when they are overlaid one on top of the other, the program lines them up correctly to build a complex data map. The base layer is almost always a geographical map, pulled from a number of sources depending on the visualisation required (road map, satellite, etc). This program has many of these available to users and even includes live feed layers including traffic information.
The first three layers are known as feature or vector layers, each containing individual features distinguished through the platform. These are:
- points (such as buildings, landmarks)
- lines (such as roads and other one-dimensional schemata)
- polygons (such as political information and geographical census, known as two-dimensional data)
- raster images (a base vector layer such as an aerial photograph)
Data can be associated with any of these spatial layers and can be both mapped and analysed, be it through attributes like demographic changes, or through data tables.
However, what sets this system apart from its competitors is the complex platform through which this data and mapping can be performed. As such, it is a very wide-reaching program subject to new updates and improvements. It is currently available only on Microsoft Windows desktops, although the online program is accessible on most operating systems. Because it operates as a platform, users needn’t wade through pages of data; tools are available to reduce and extract particular information from much larger geographical datasets. In sum, it is a one-stop solution to data collection, management and analysis as filtered through map building.
Complex Graphics and Data
This software allows you to quickly produce stunning visual maps and models, including 3D renderings and population flow maps. With a drag-and-drop feature, spreadsheets of data can be loaded quickly onto the cloud and visualised. There is also a smart mapping tool which suggests the best classifications, styles and colours to fit your data.
Imagery is available in high-resolution, taken from both historic and recent sources worldwide, allowing for the construction of historical maps as well as recent demographic data observations. Surface phenomena, such as temperature, elevation, rainfall and so on, can also be fully integrated into these visual maps and models with unique tools for surface analysis.
Where is it Used?
As an industry leading platform, the suite of tools and applications central to this program is used by a large majority of institutions, companies and departments dealing with geographical data analysis. Yet the simplicity of its online interface has also seen its value jump in journalistic and media use as well.
Esri software comes with a strong history and reputation. This fact makes it to a staple piece of software for many companies dealing in geographical information systems. In particular, it is used by local and state governments around the world, including in the United States of America.
Types of Software
This software comes in several different incarnations, from a standard desktop package to a solely web-based program. The desktop package includes the base suite to publish and manage data, as well as providing access to both the online and “Enterprise” options. The online version includes many of the features required to create web maps and web apps using geographical data. There is a readymade gallery of base maps and styles to choose from and a whole host of data piles to visualise.
Of course you can input your own data too. The benefits of the online program include the sharing of content throughout and even outside your organisation. Groups can access private maps on invite, allowing for collaboration. Further components of the software platform include apps, such as a collection, navigation and surveying tools, as well as quick explorer and workforce tools for coordinated field work. What’s more, trial accounts can be registered to get to know the software and see if it meets your requirements.